
What is the MoCA Web Application?The MoCA Web Application was developed so research contributors can easily access, create, update and visualize MoCA research datasets. Much better than a spreadsheet!
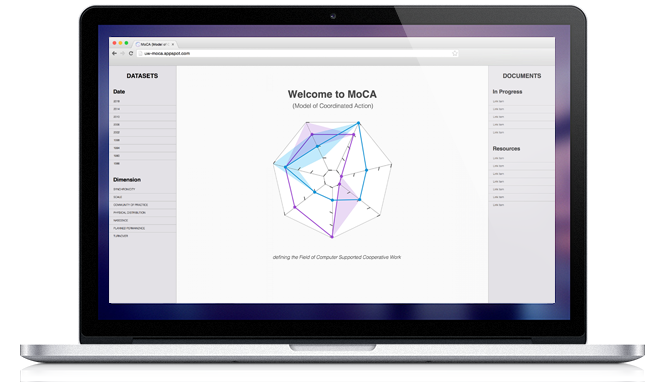
What is MoCA?MoCA (Model of Coordinated Action) is a new theoretical framework for understanding differences in how people collaborate. The model is designed to describe the problem space of Computer-Supported Cooperative Work (CSCW) but can be extended to other fields and domains. I have been a research assistant with MoCA for over two years. My main tasks as a research assistant are to conduct a retrospective content analysis of CSCW publications, an analysis of coded publications, and an interdisciplinary literature review regarding network dynamics and collaboration. Learn more about MoCA.
I developed the web application with the help of another research assistant in the CSC Lab. I created the wireframe sketches and worked with the research assistant to confirm the application design plan met all of our requirements. I developed the web application with a Python back-end, leveraging Google App Engine. The fellow research assistant on the project coded the email feature in the website application.
Since January of 2015, our research team has been compiling MoCA research data using Google spreadsheets. Although convenient to use Google spreadsheets, it has proven aesthetically difficult to showcase our findings to other research contributors and manage data collection as the datasets grew. The MoCA website application is a step toward creating a better user interface design.
Design process: requirements gathering, wireframe sketches, digital wireframe, usability tests, high fidelity mockup, front-end development, backend development, testing, deployment
I gathered, synthesized, and prioritized a list of requirements before any sketches were done. I met with the with MoCA team to brainstorm possible functionality and affordances the new web application would grant us.
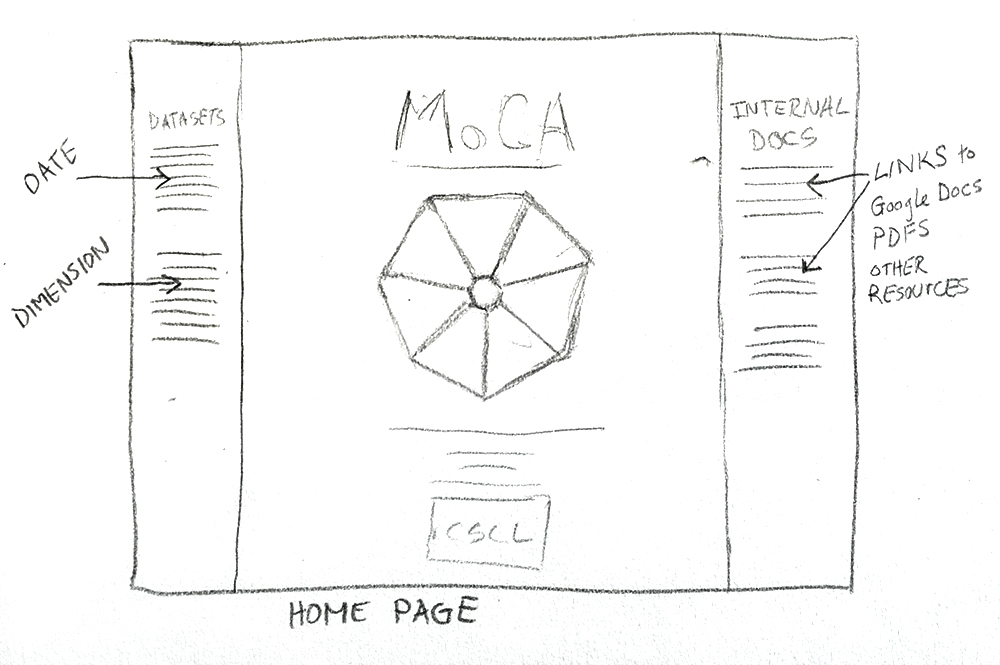
Once the requirements were evaluated with the MoCA team, I created wireframe sketches that highlight the best ideas that fit the requirements. As a MoCA research assistant and user of the web application, I knew the problem space fairly well to jump in with the wireframe sketches. Below are the wireframe sketches I created.


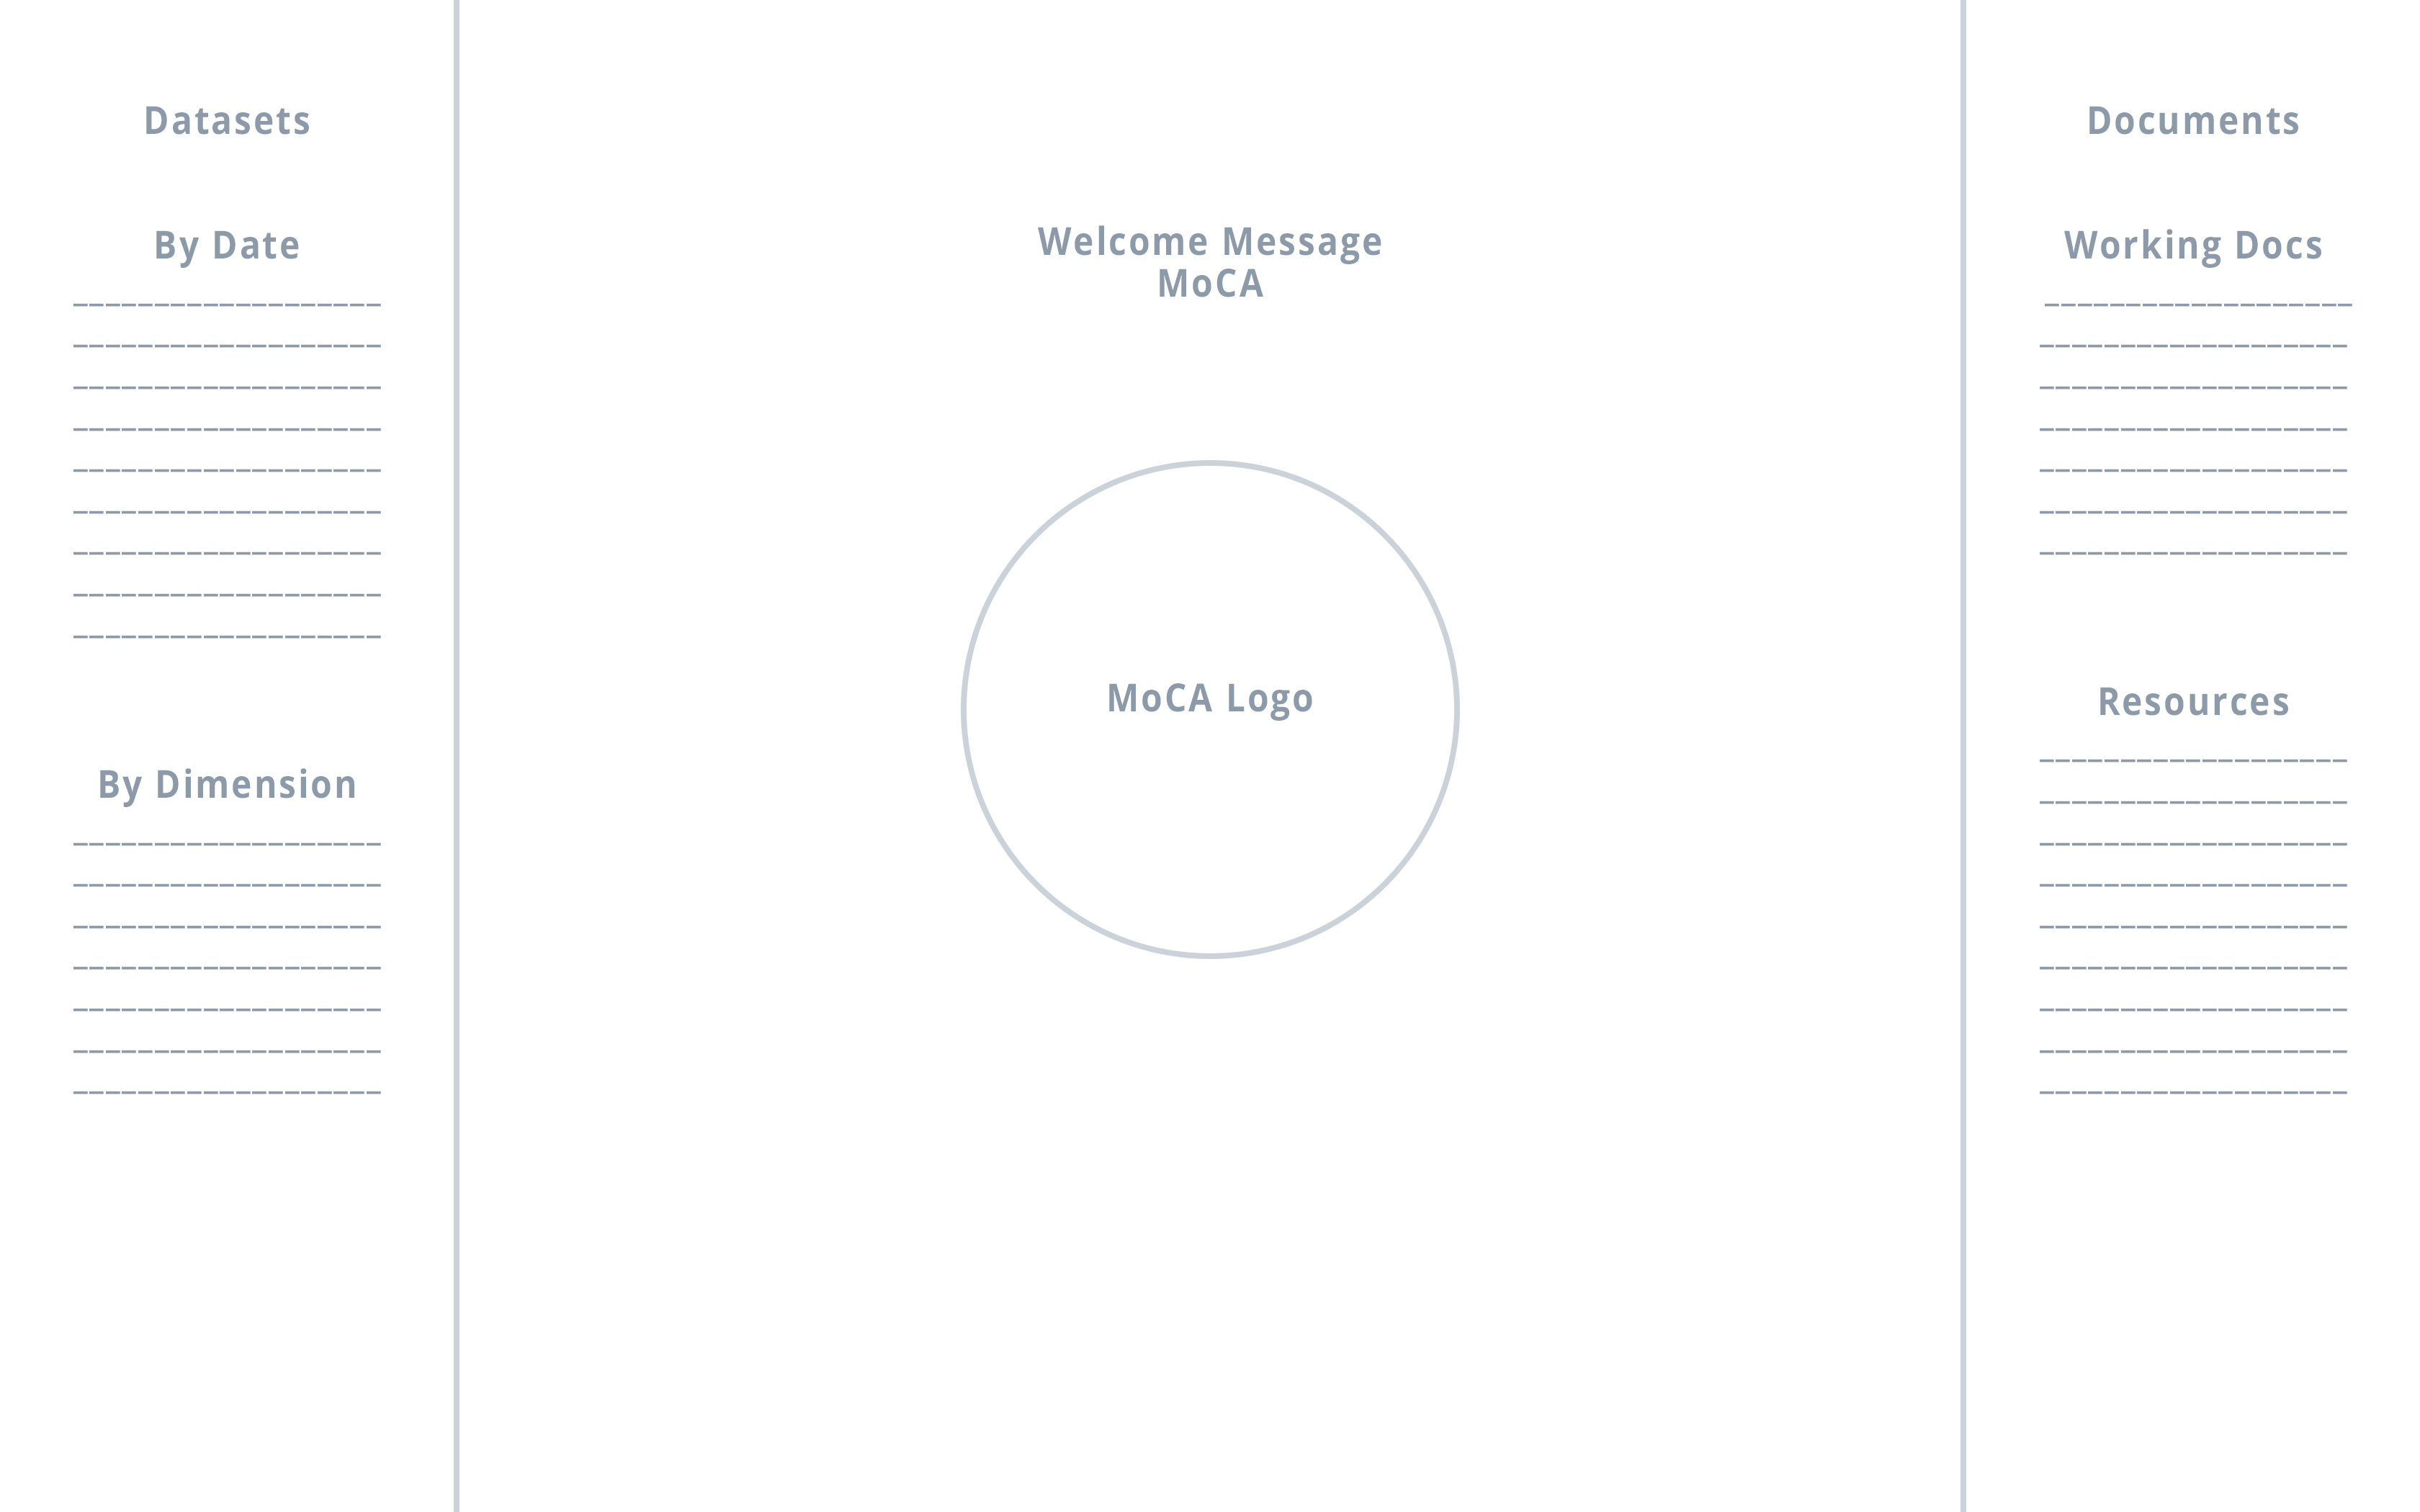
Using the wireframe sketches above, I created digital wireframes, which were used to confirm the vision of the web application with everyone on the team, before development began. See the digital wireframe below.
Front-End Design & Development Once a wireframe was finalized by the team, I developed the front-end design from the digital wireframes using HTML, CSS, and Javascript. See screenshots of the demo pages below.
The original plan was to store data locally. However, after discussing the editing and scaling flexibilities that using Google App Engine's data store could bring to our project with a professor, we decided to go forward with it.
I developed the website application using Python, Django, and Jinja2. The Google Maps API was used to convert field location data called from the spreadsheet to an embedded map with multiple location pins. I used the Python Starter code to get started. I tested the web application using a small data set. A fellow research assistant on the MoCA team coded the email approval feature of the website application.
Check out the full Resource Writeup here.
 I created a demo using a small data sample.
The source code can be found on GitHub.
I added annotations for each screenshot to add concision and clarity to each component in the wireframe. The annotations include rationale for the design decisions. They are to help situate a new researcher, developer, or other team member when necessary.
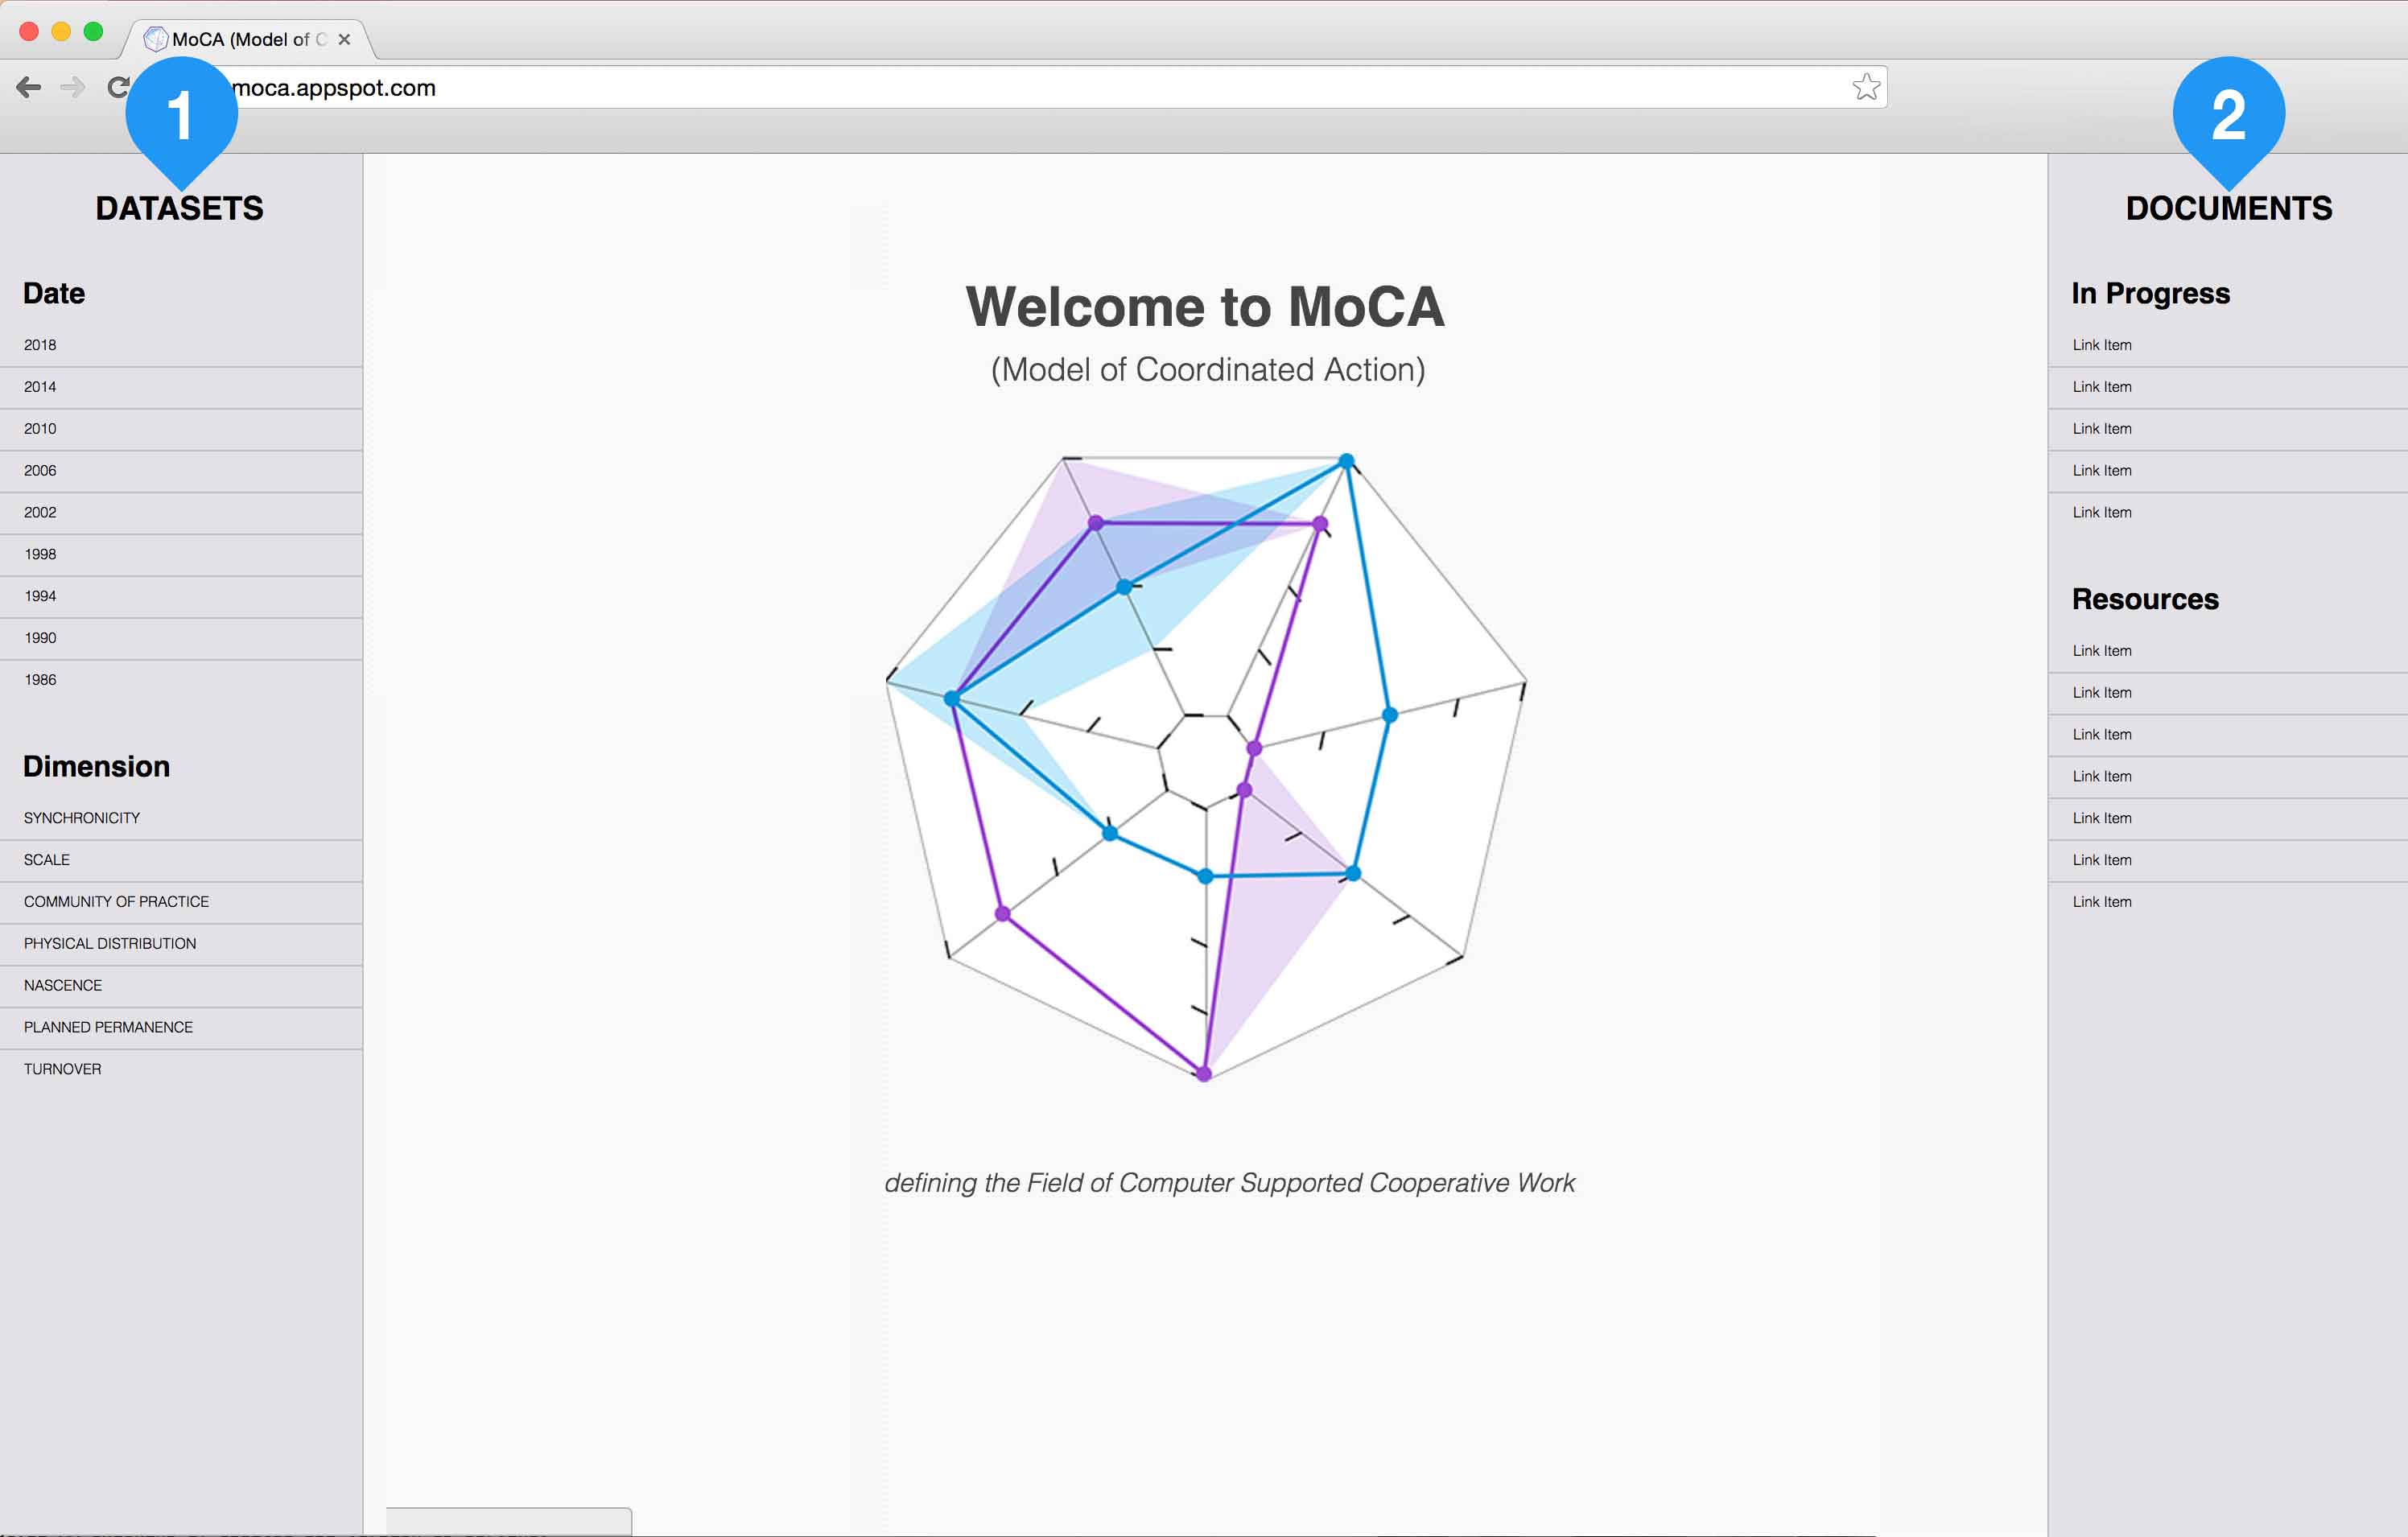
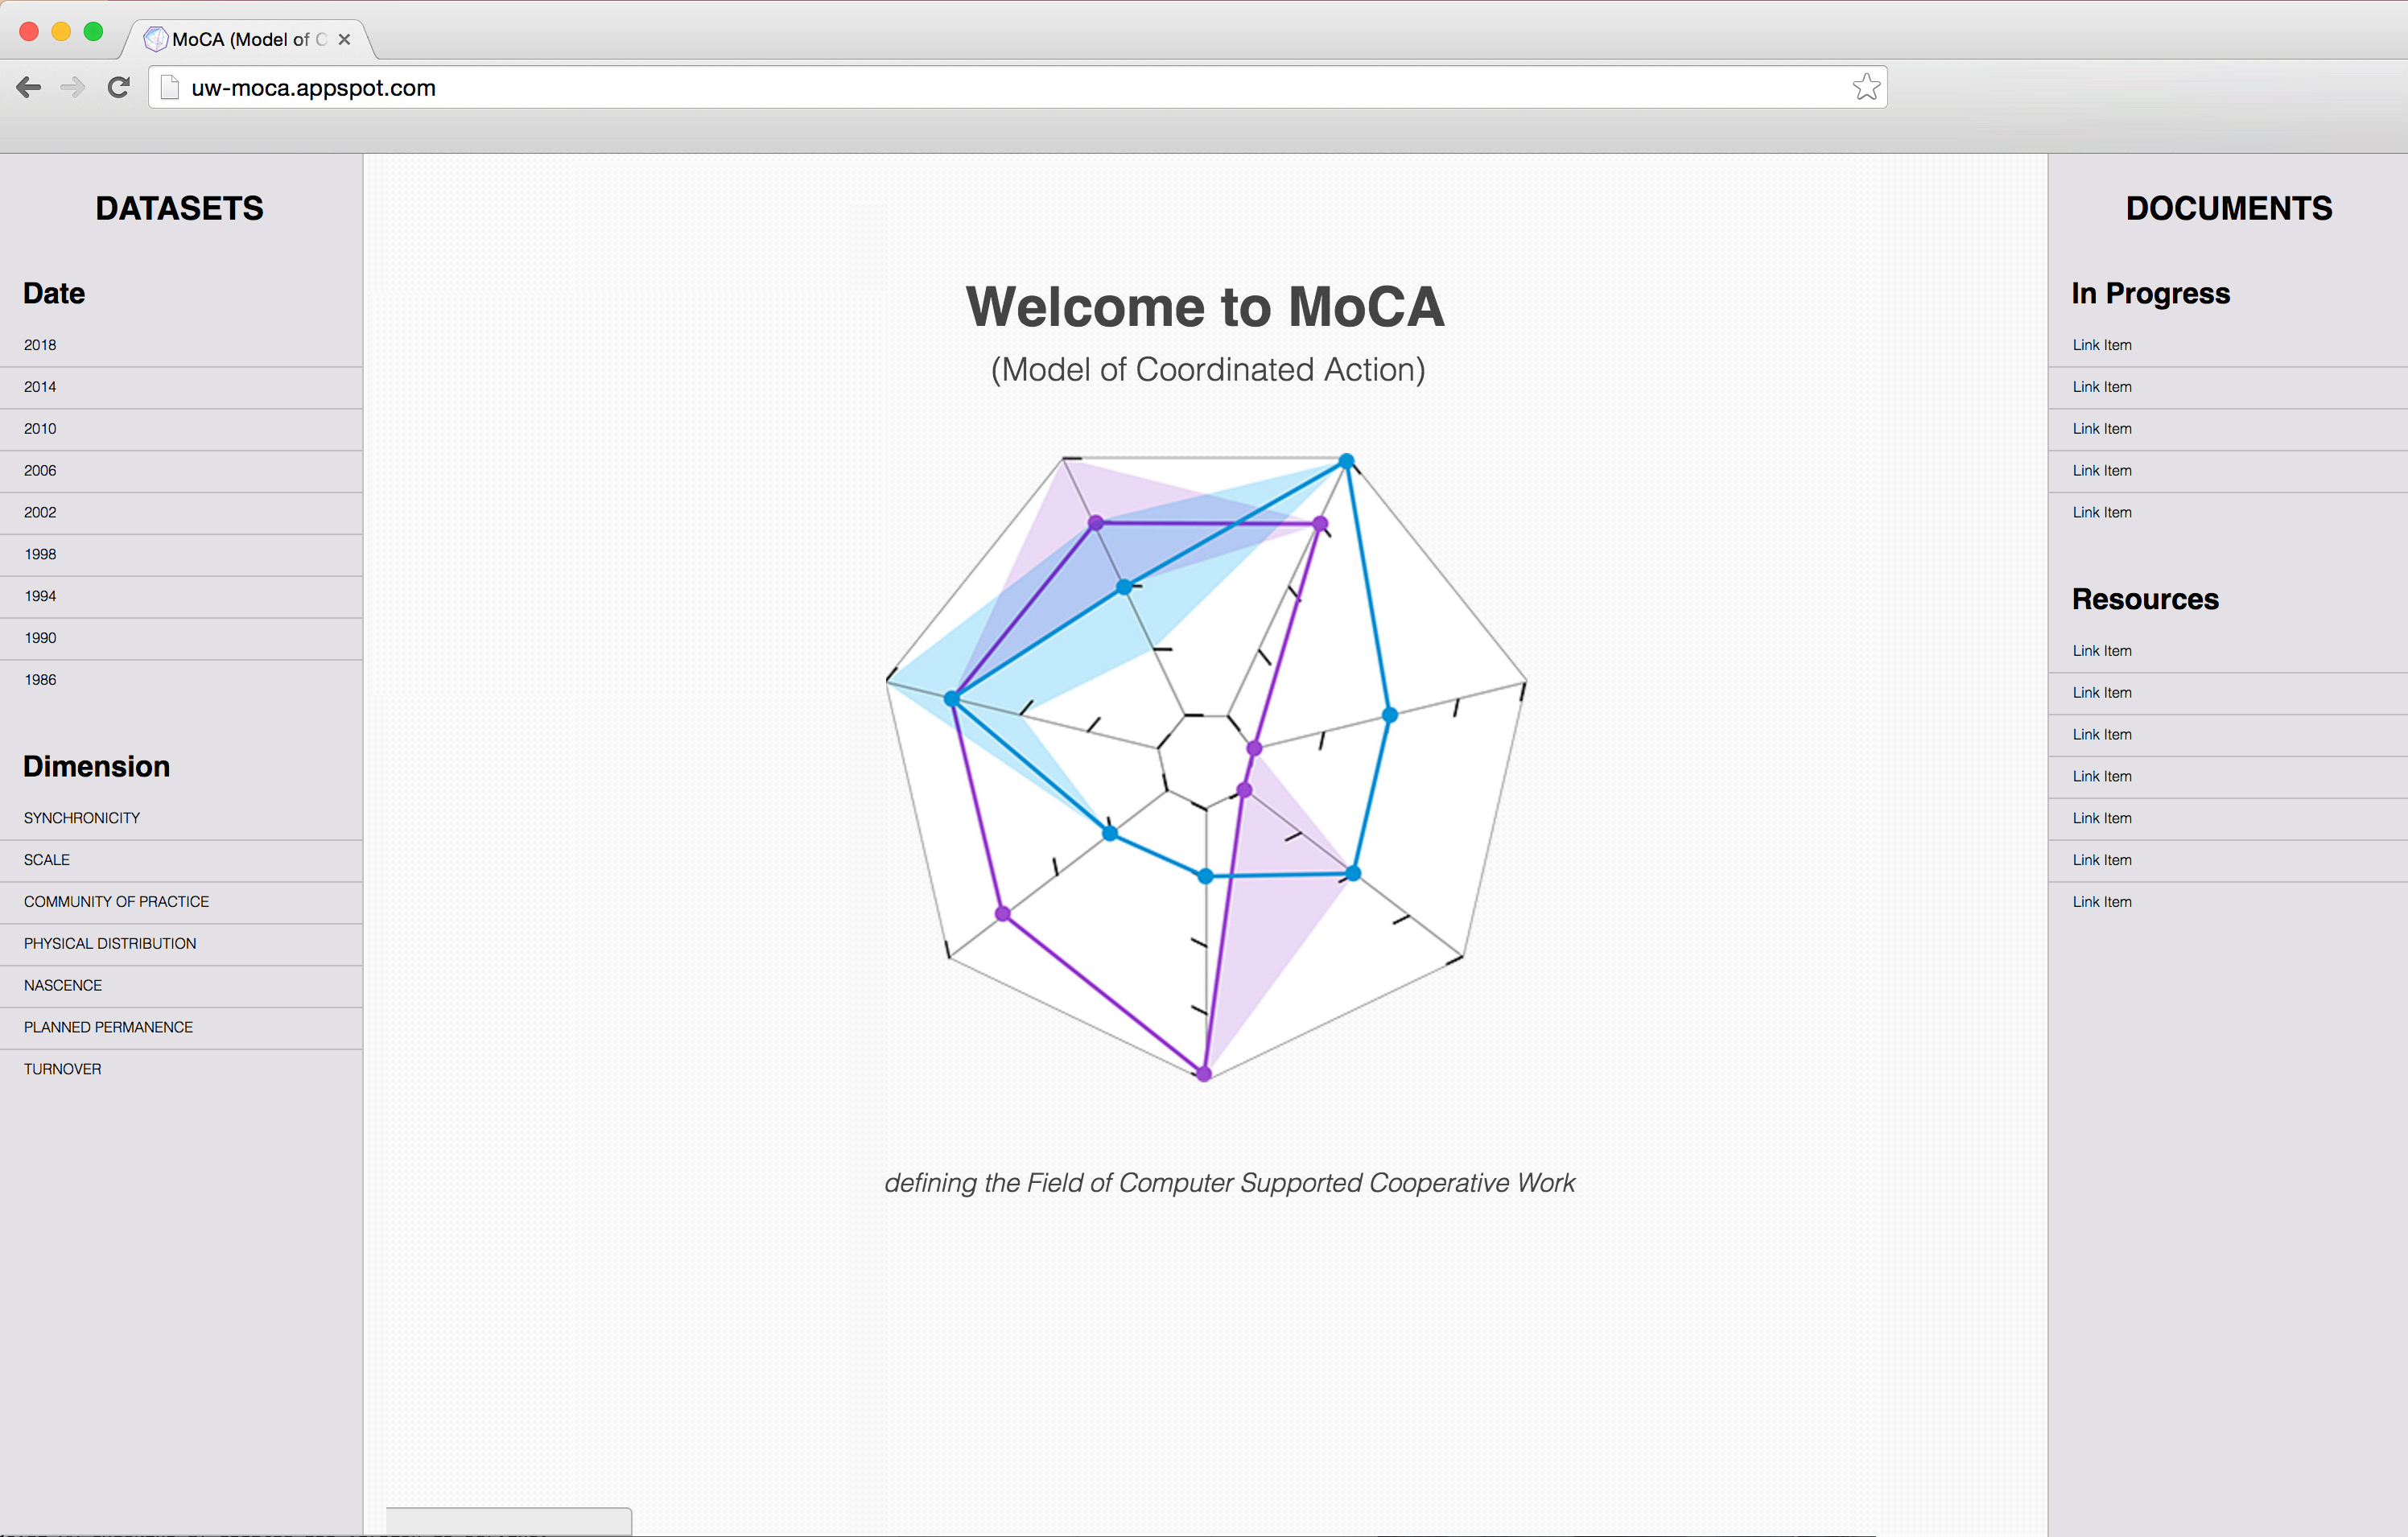
The home page has a welcoming message in the center.
1. Dataset Menu has a list of datasets categorized by data and dimension.
2. Documents Menu has a list of working documents and resources.
The home page has a welcoming message in the center.
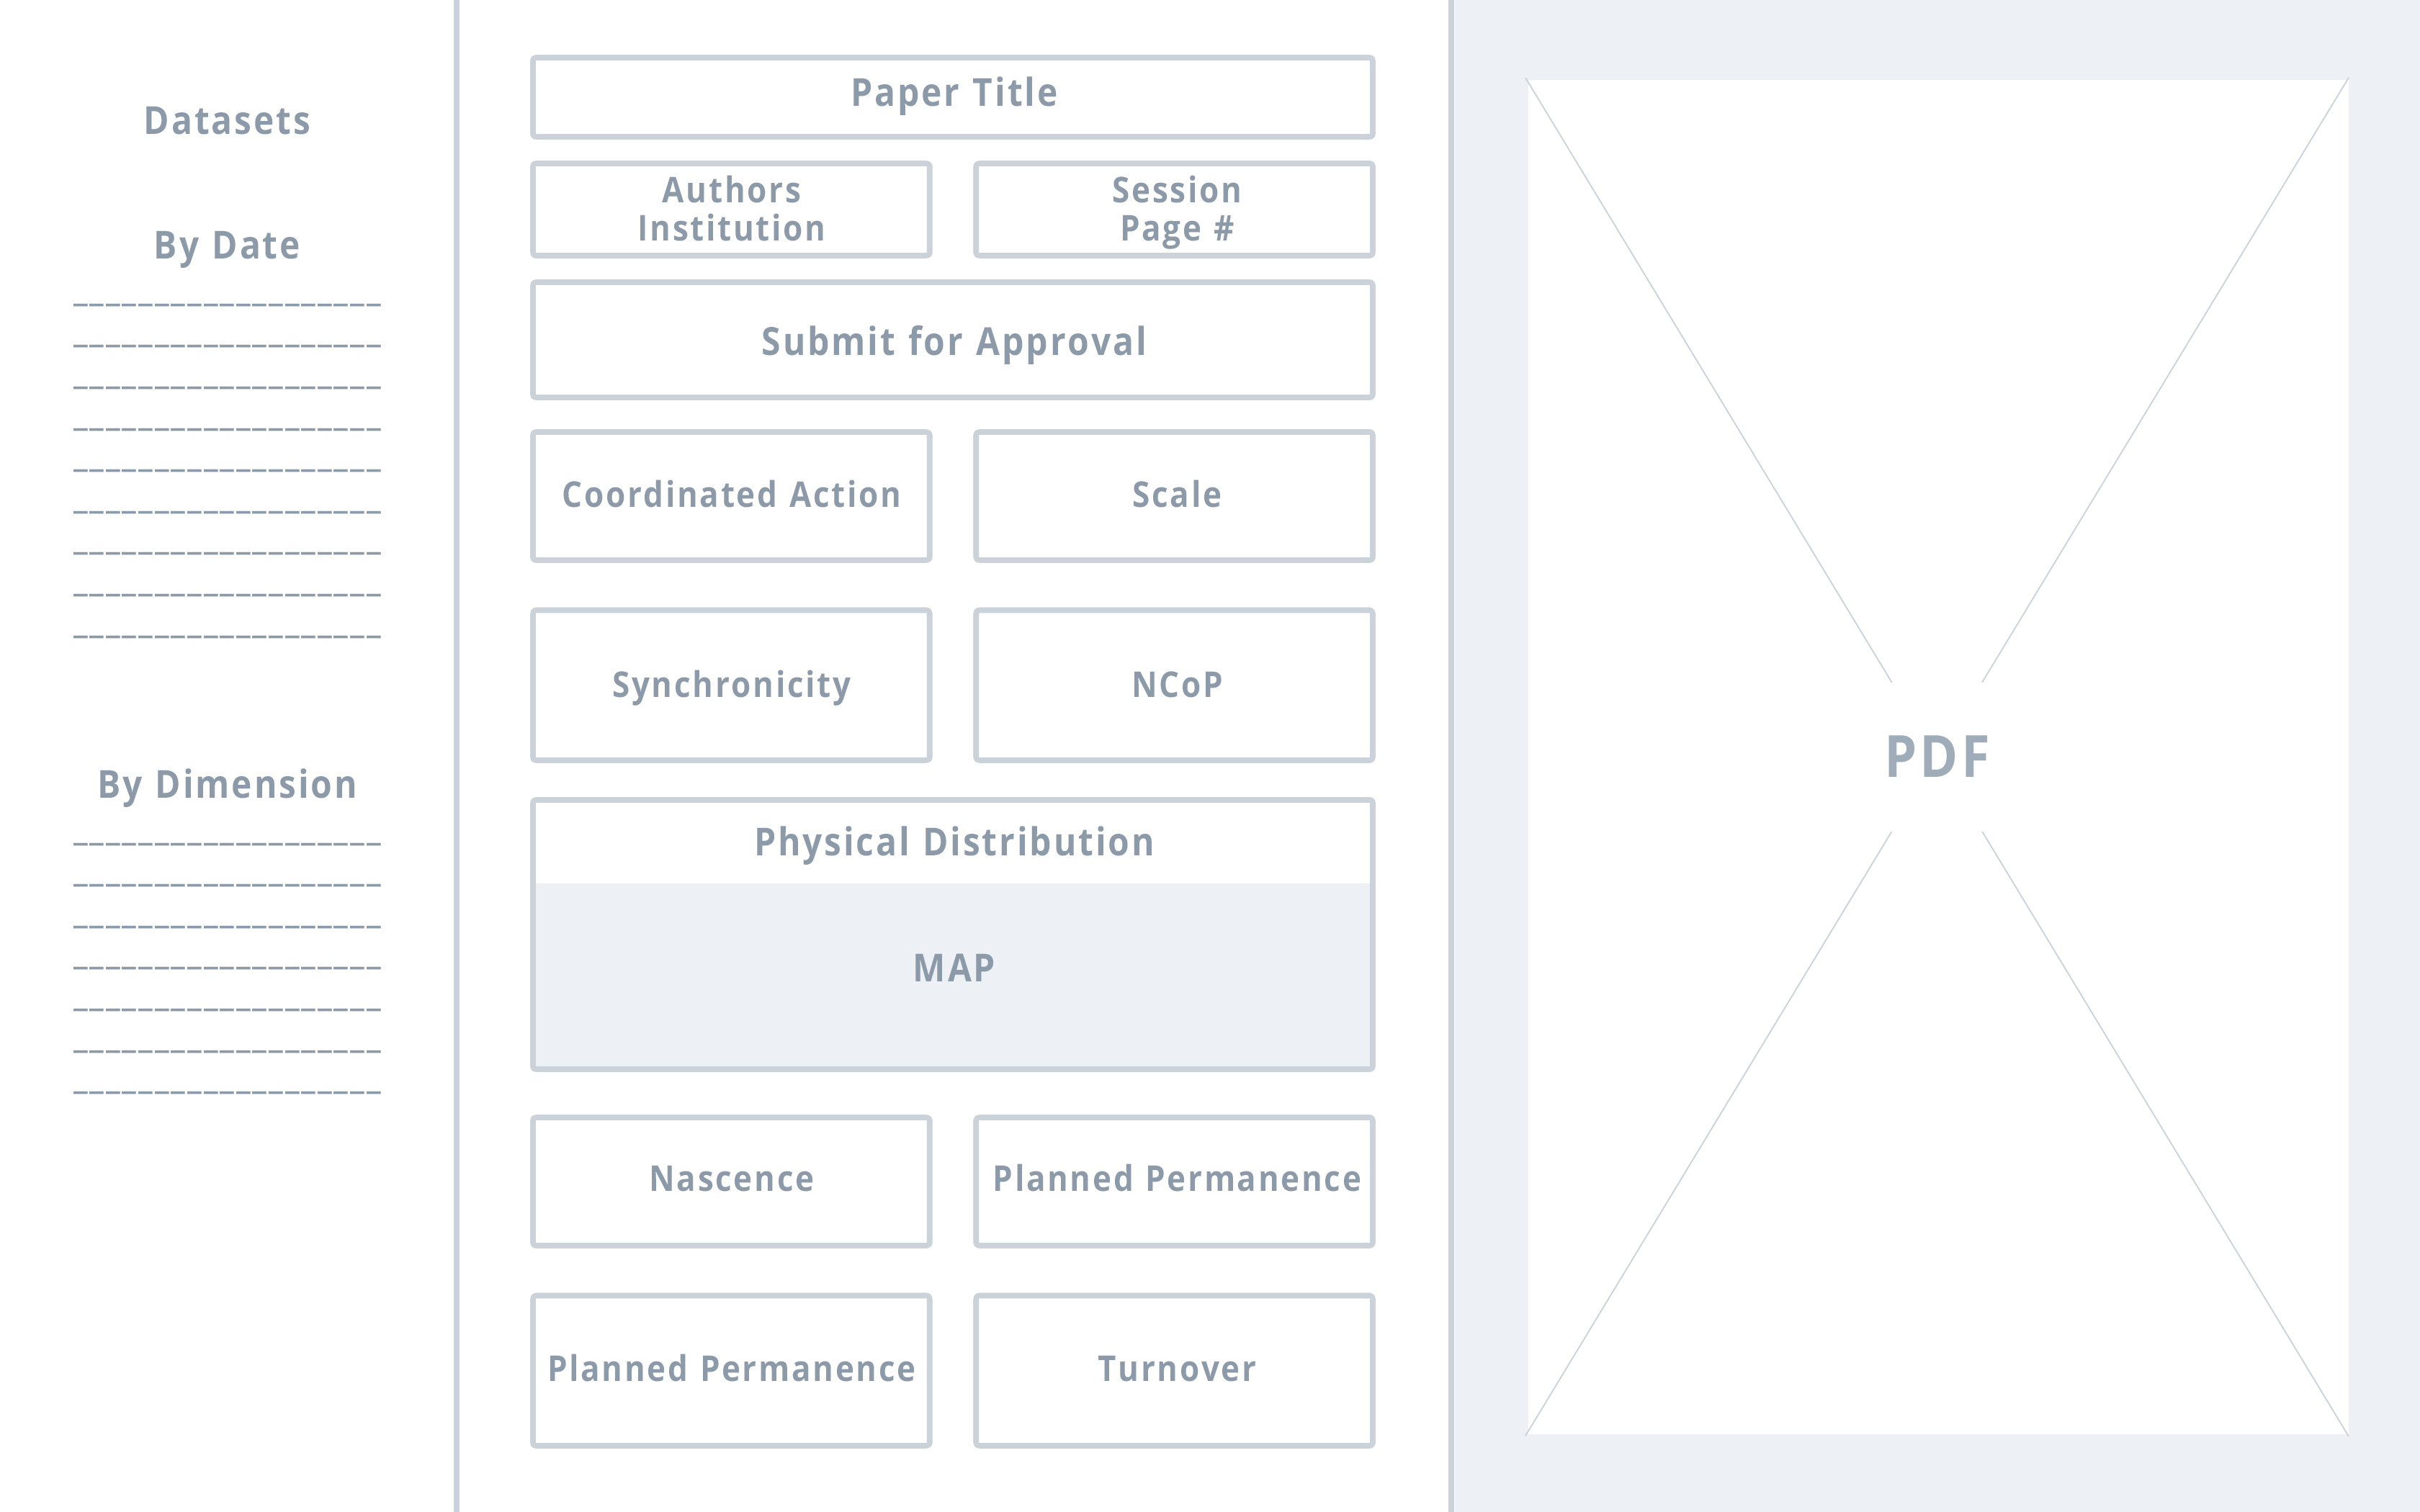
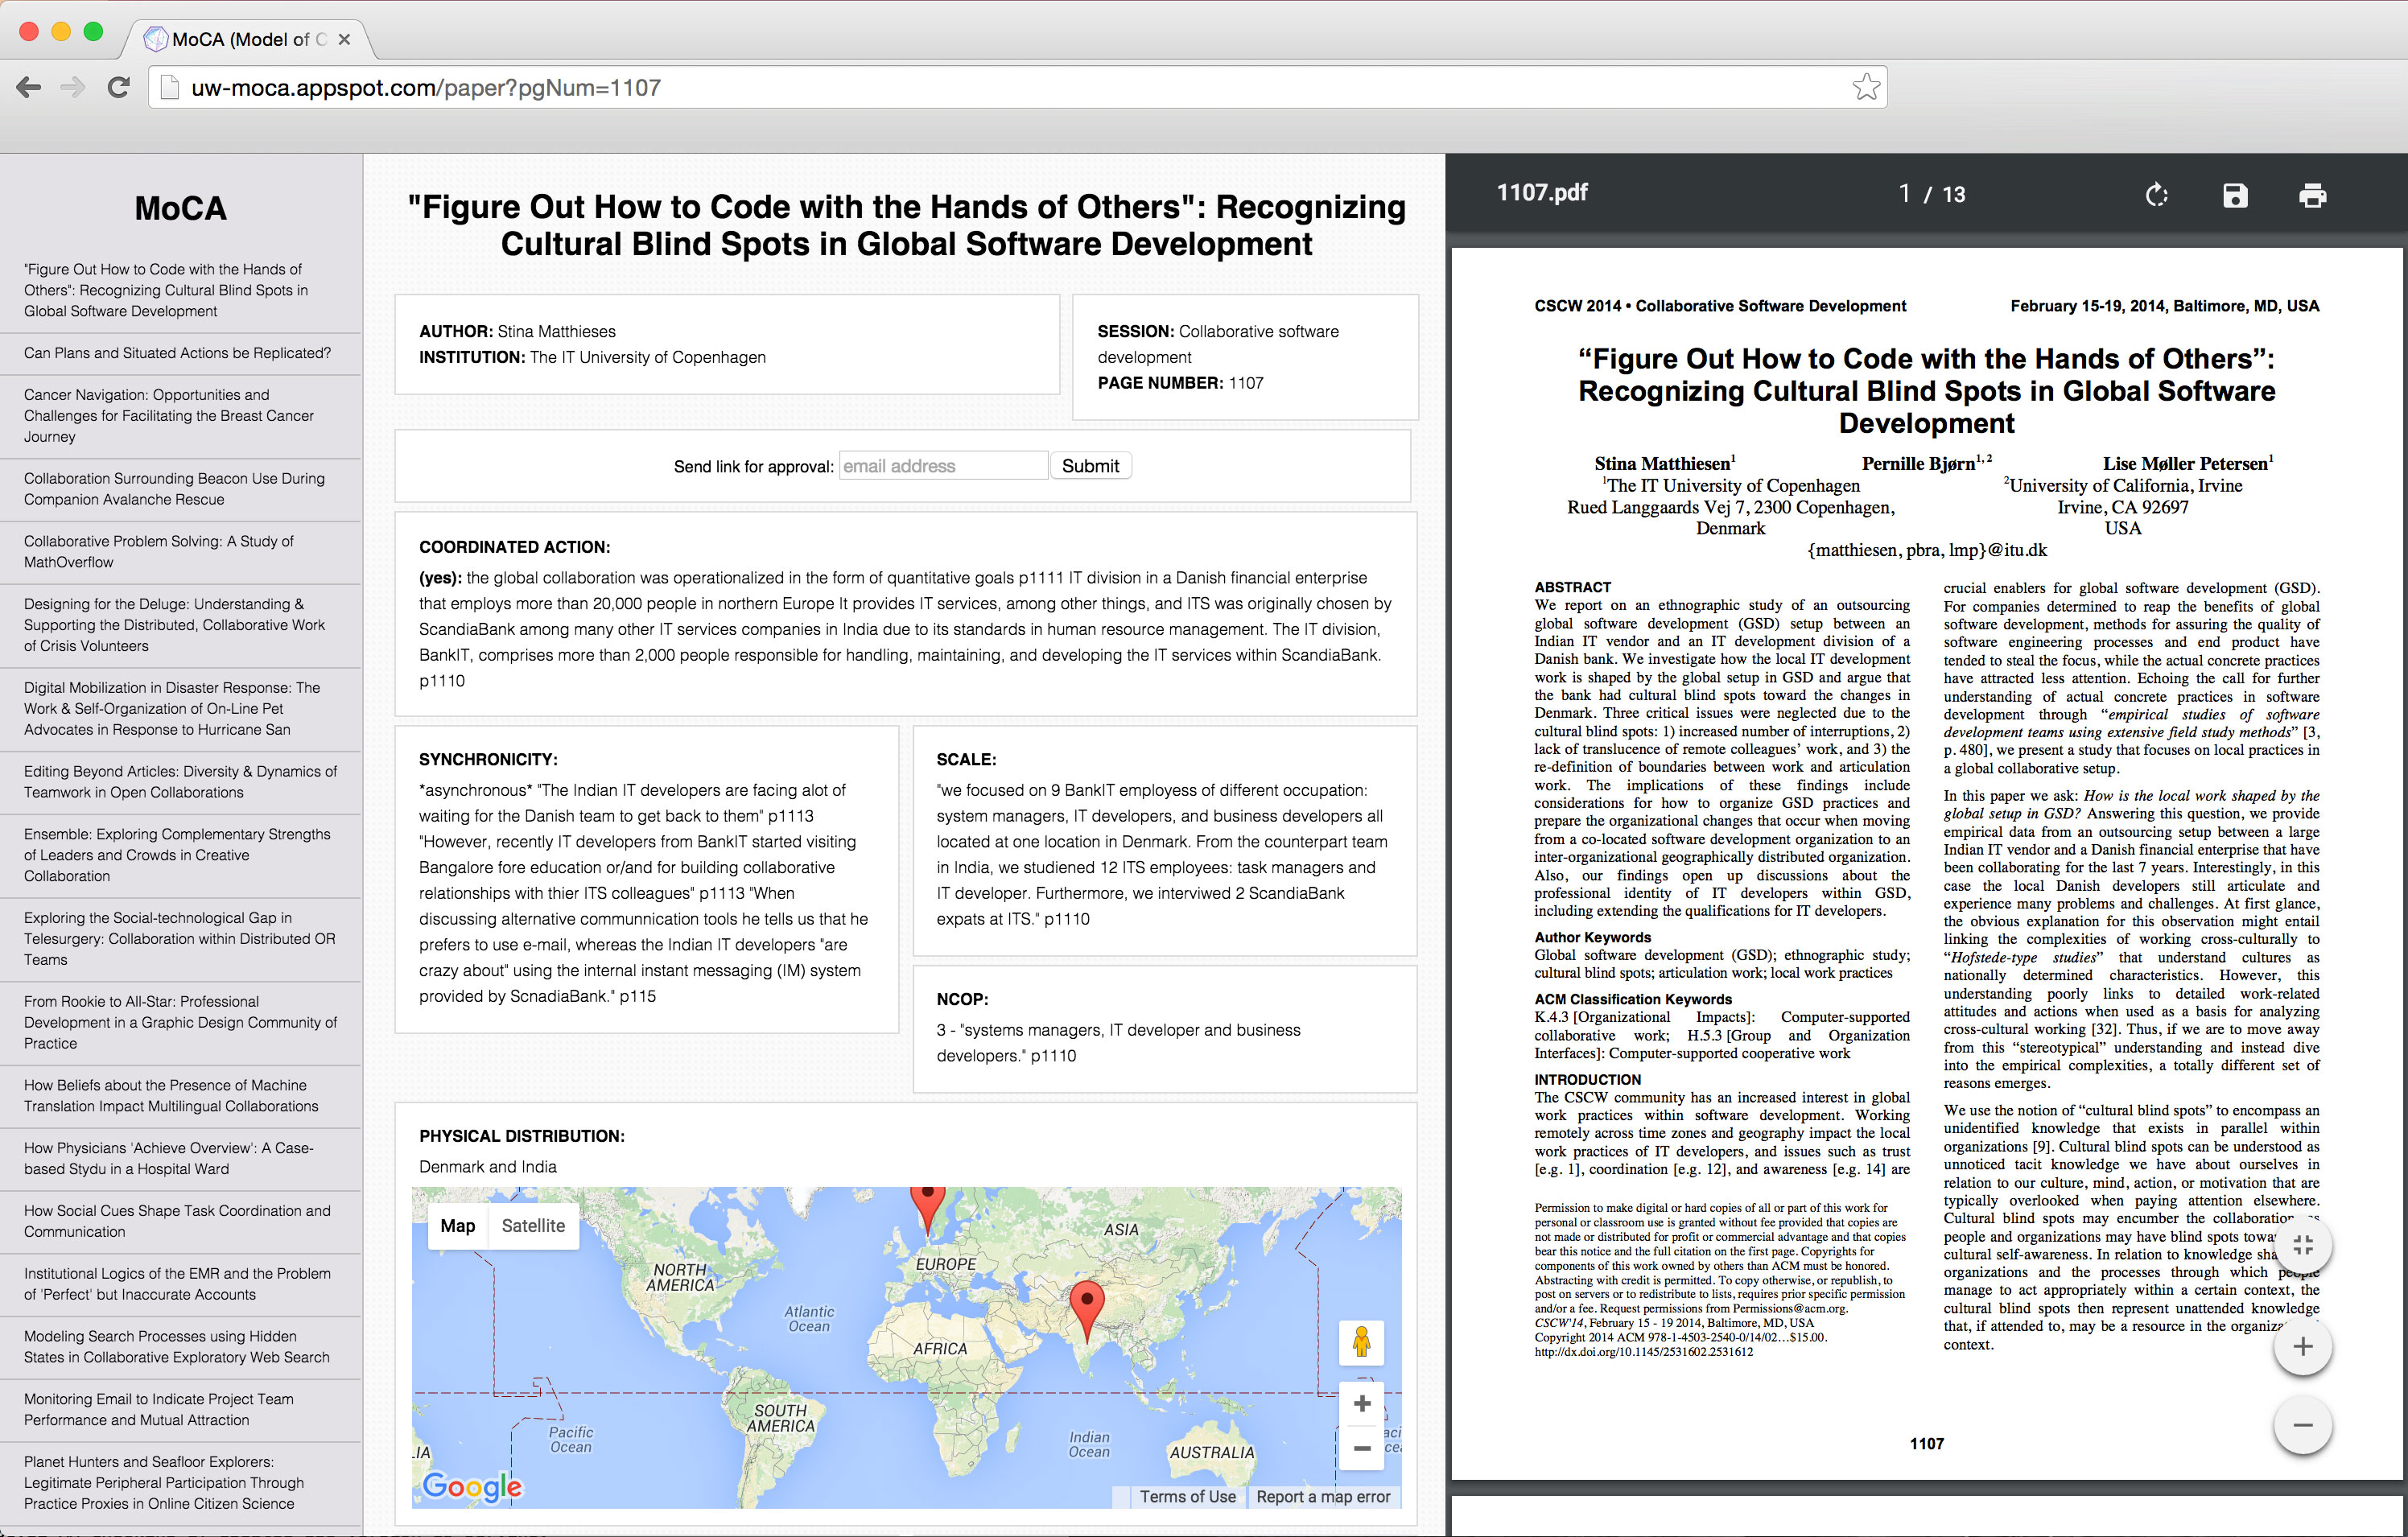
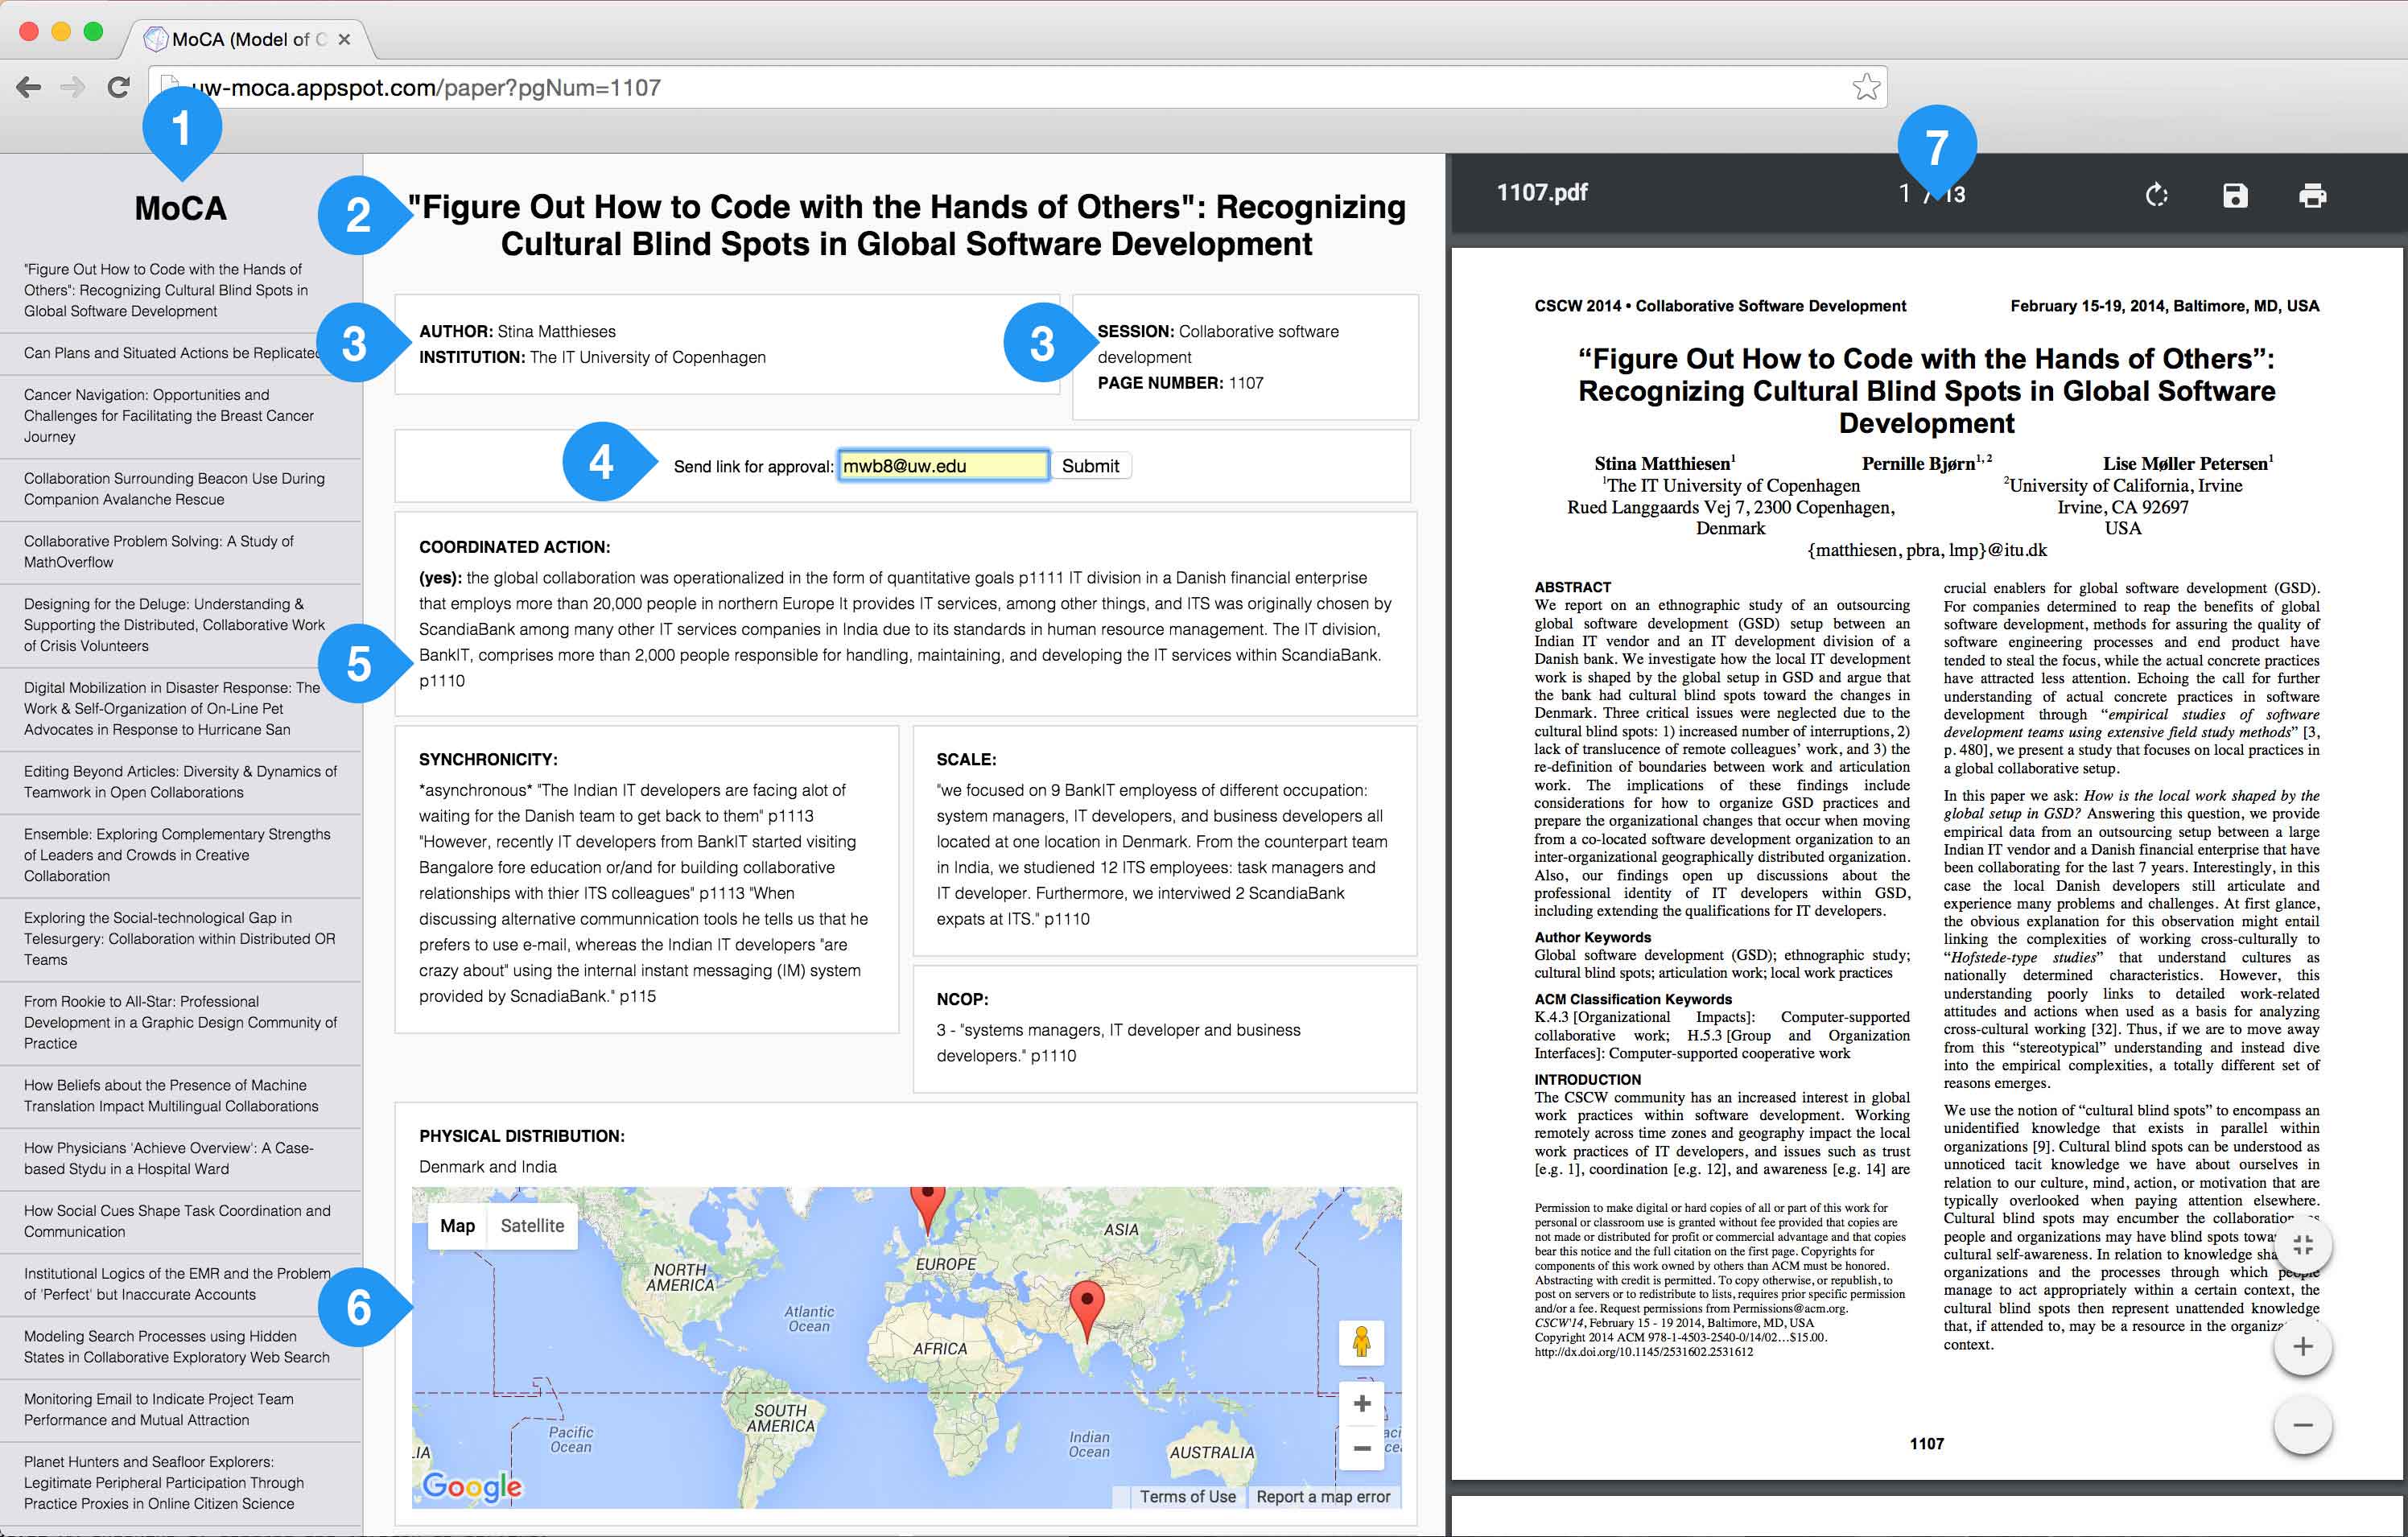
1. List of papers in the dataset ordered by page number. Clicking on a link will load the data for the paper.
2. Paper Title
3. Paper Meta Data
4. Submit Approval Email
5. Editable Fields for MoCA Data
6. Google Maps
7. Scrollable PDF of Paper
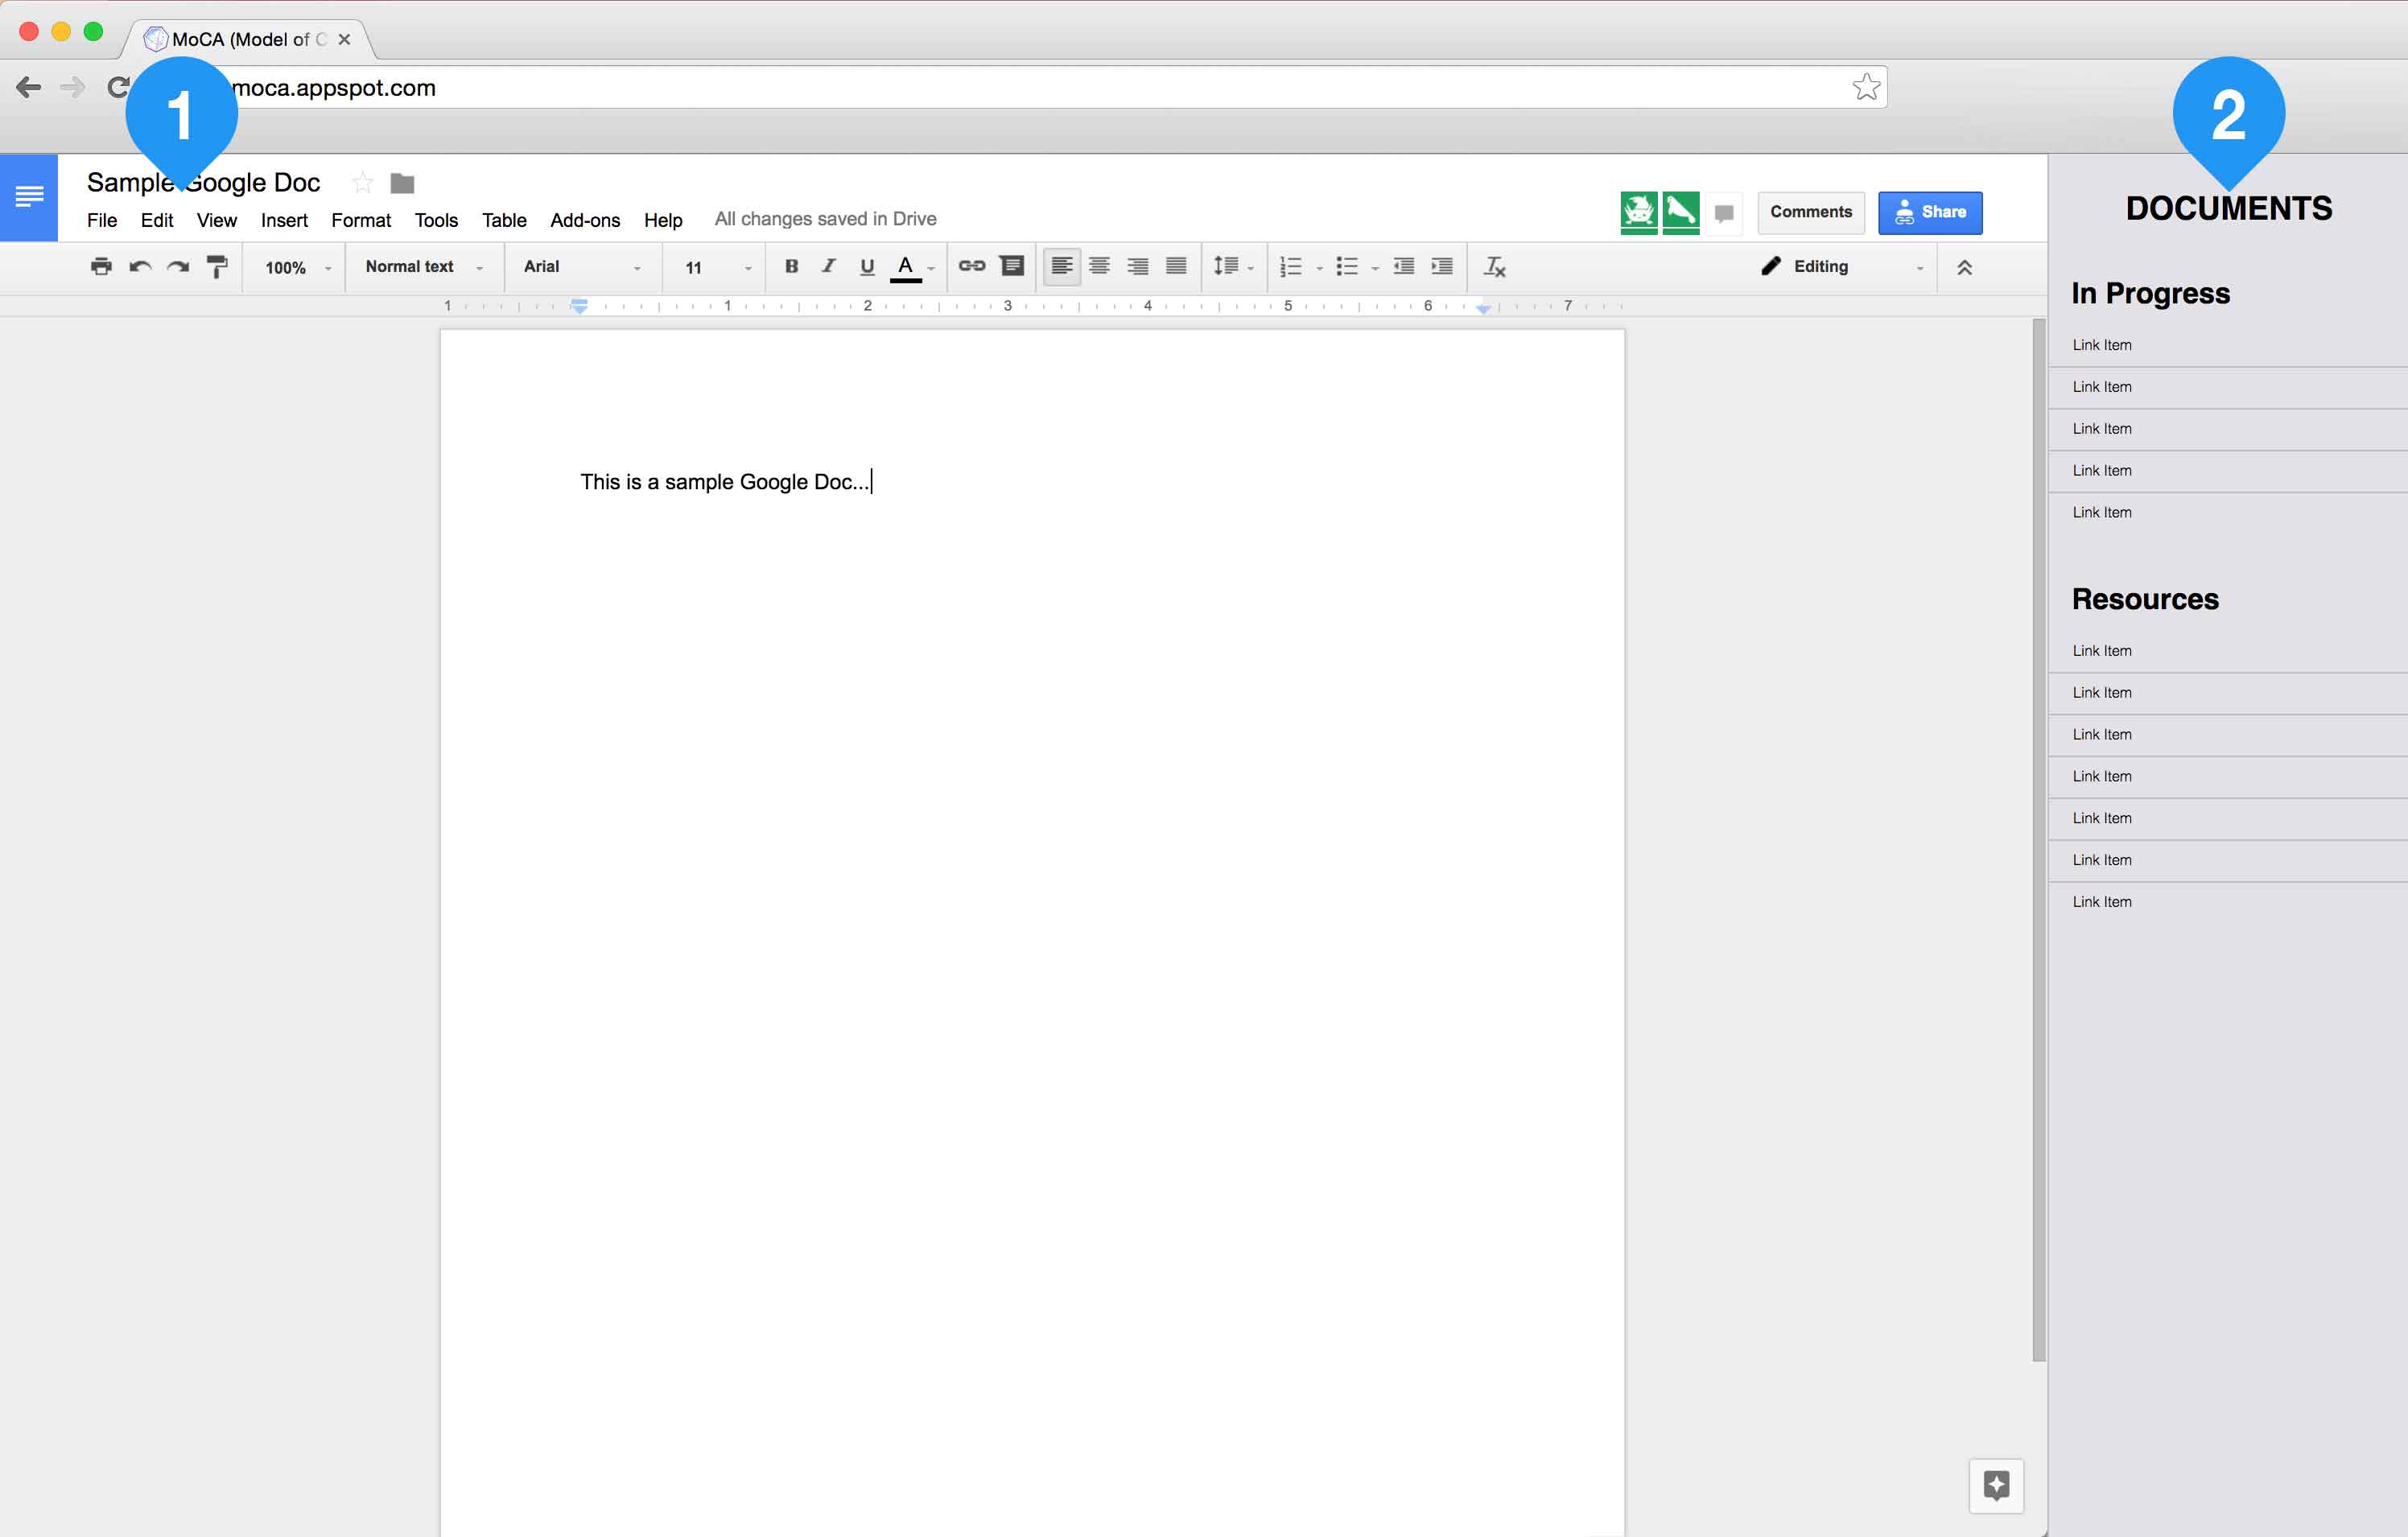
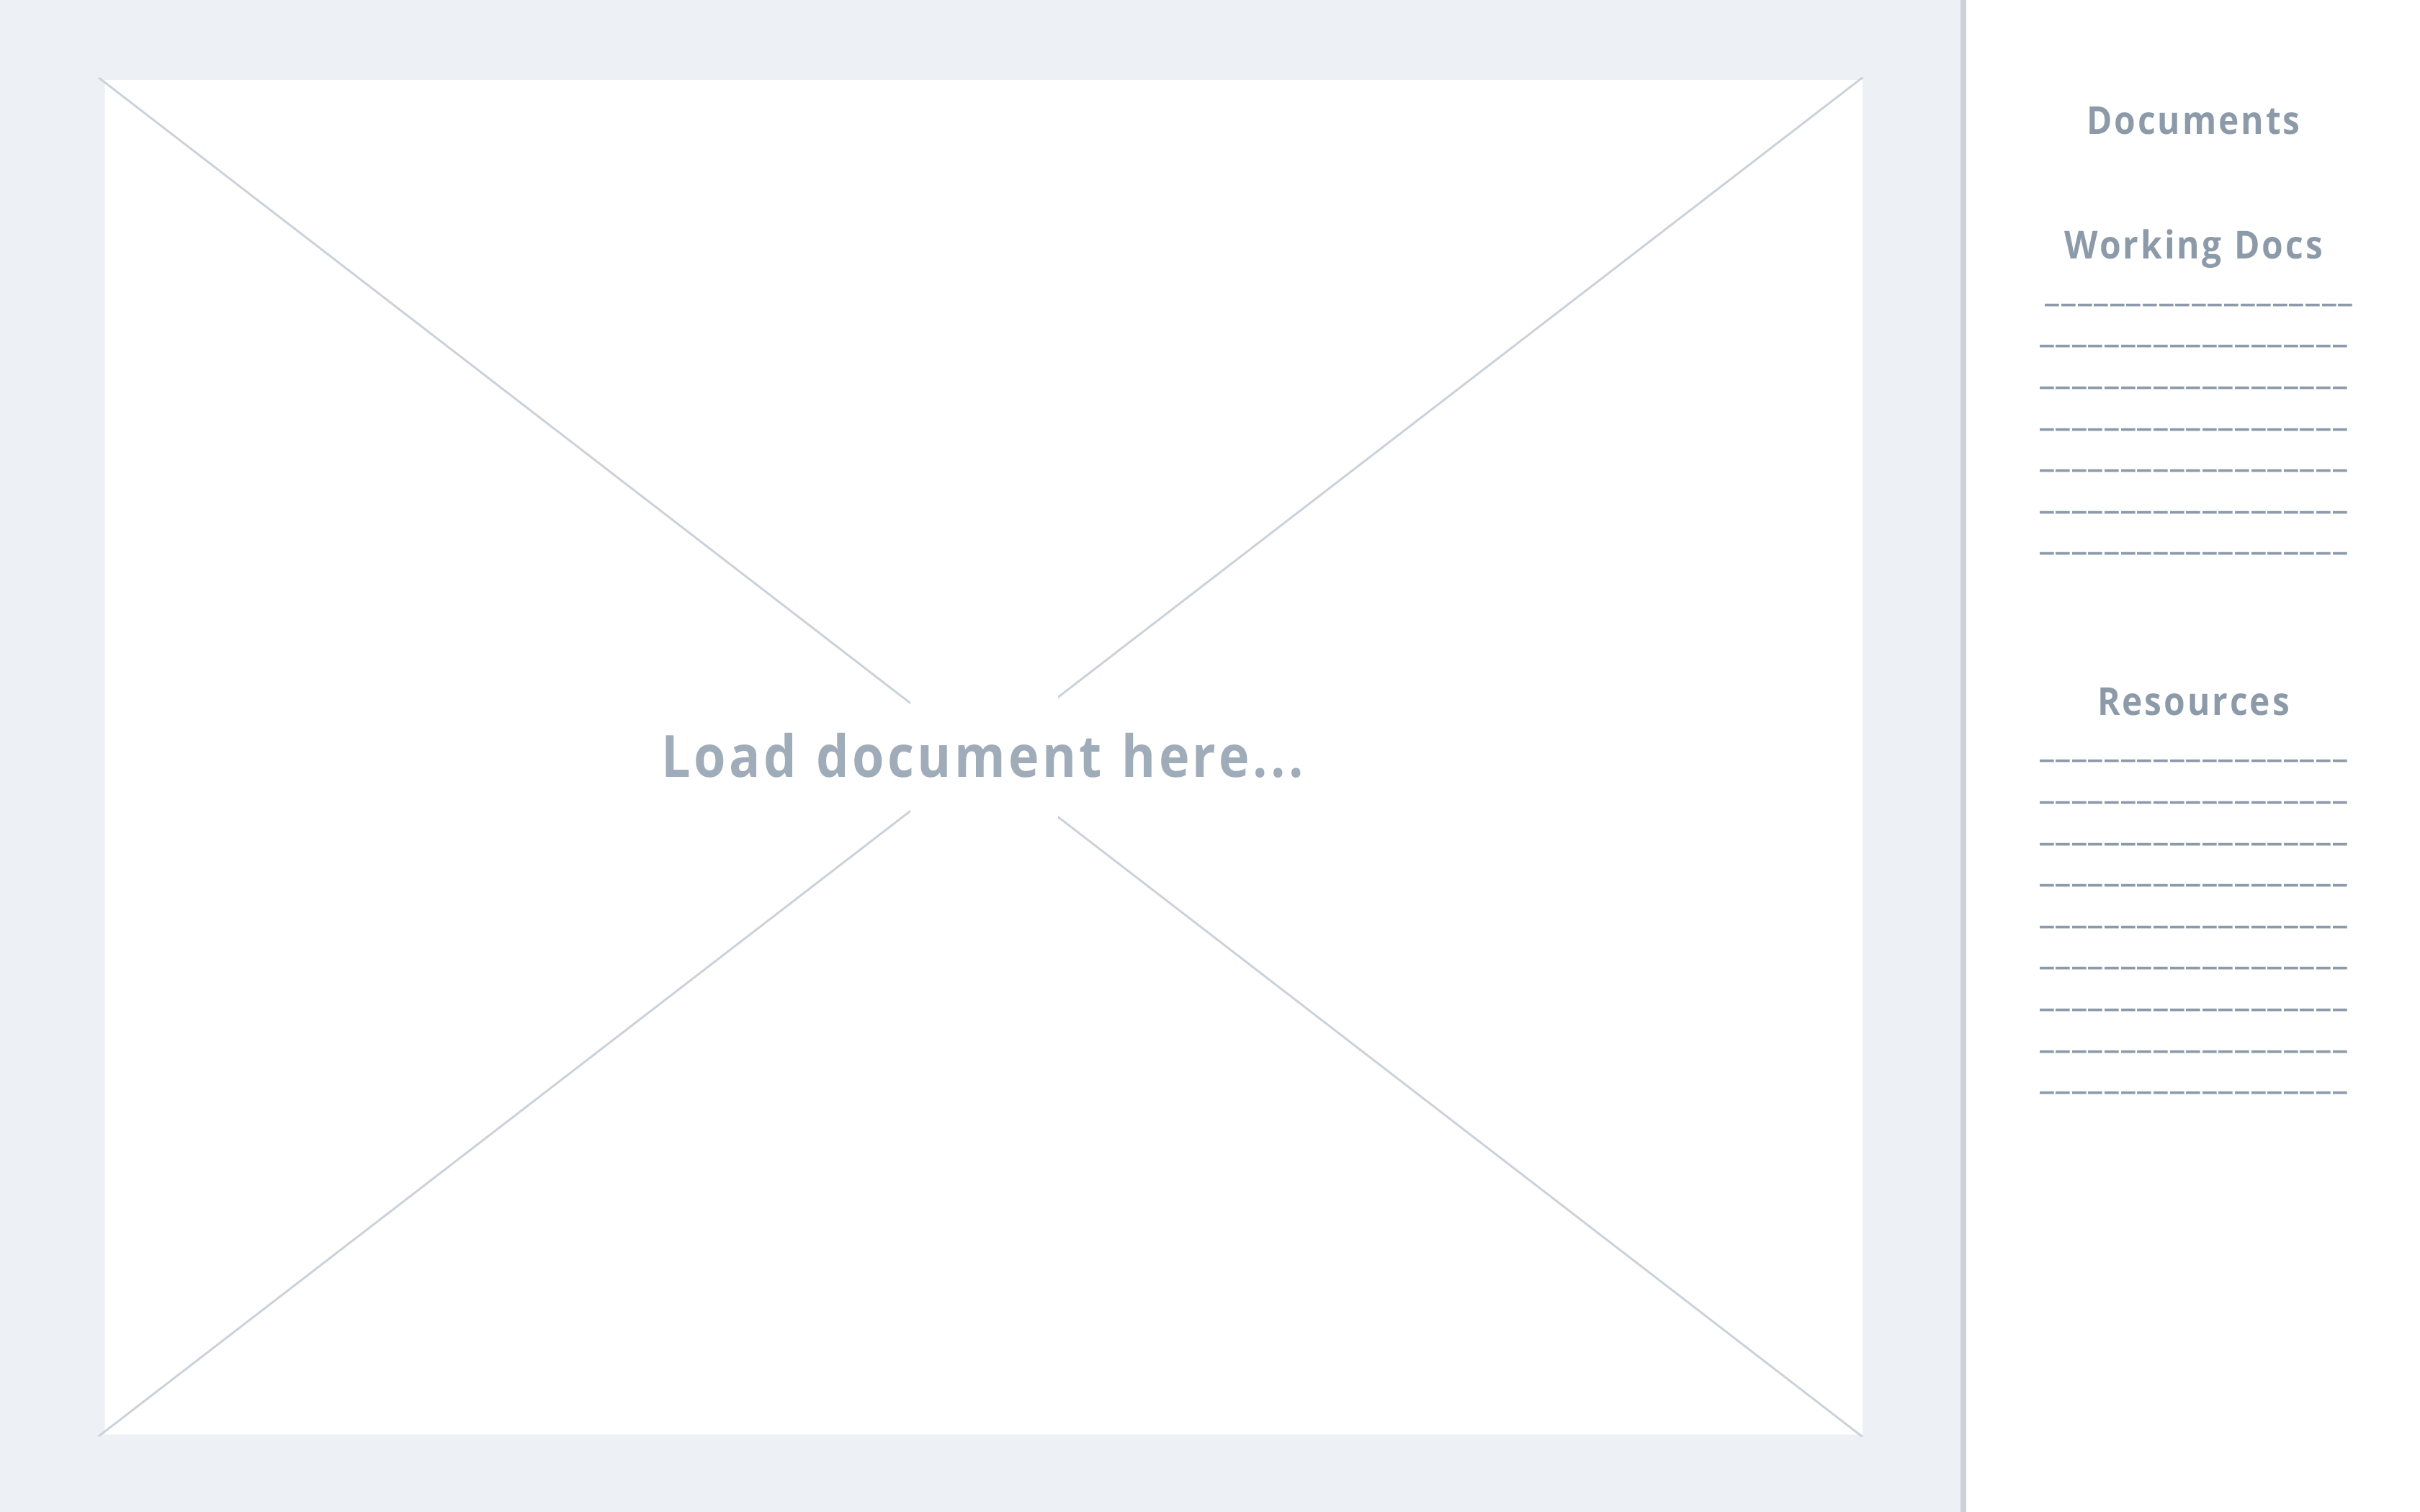
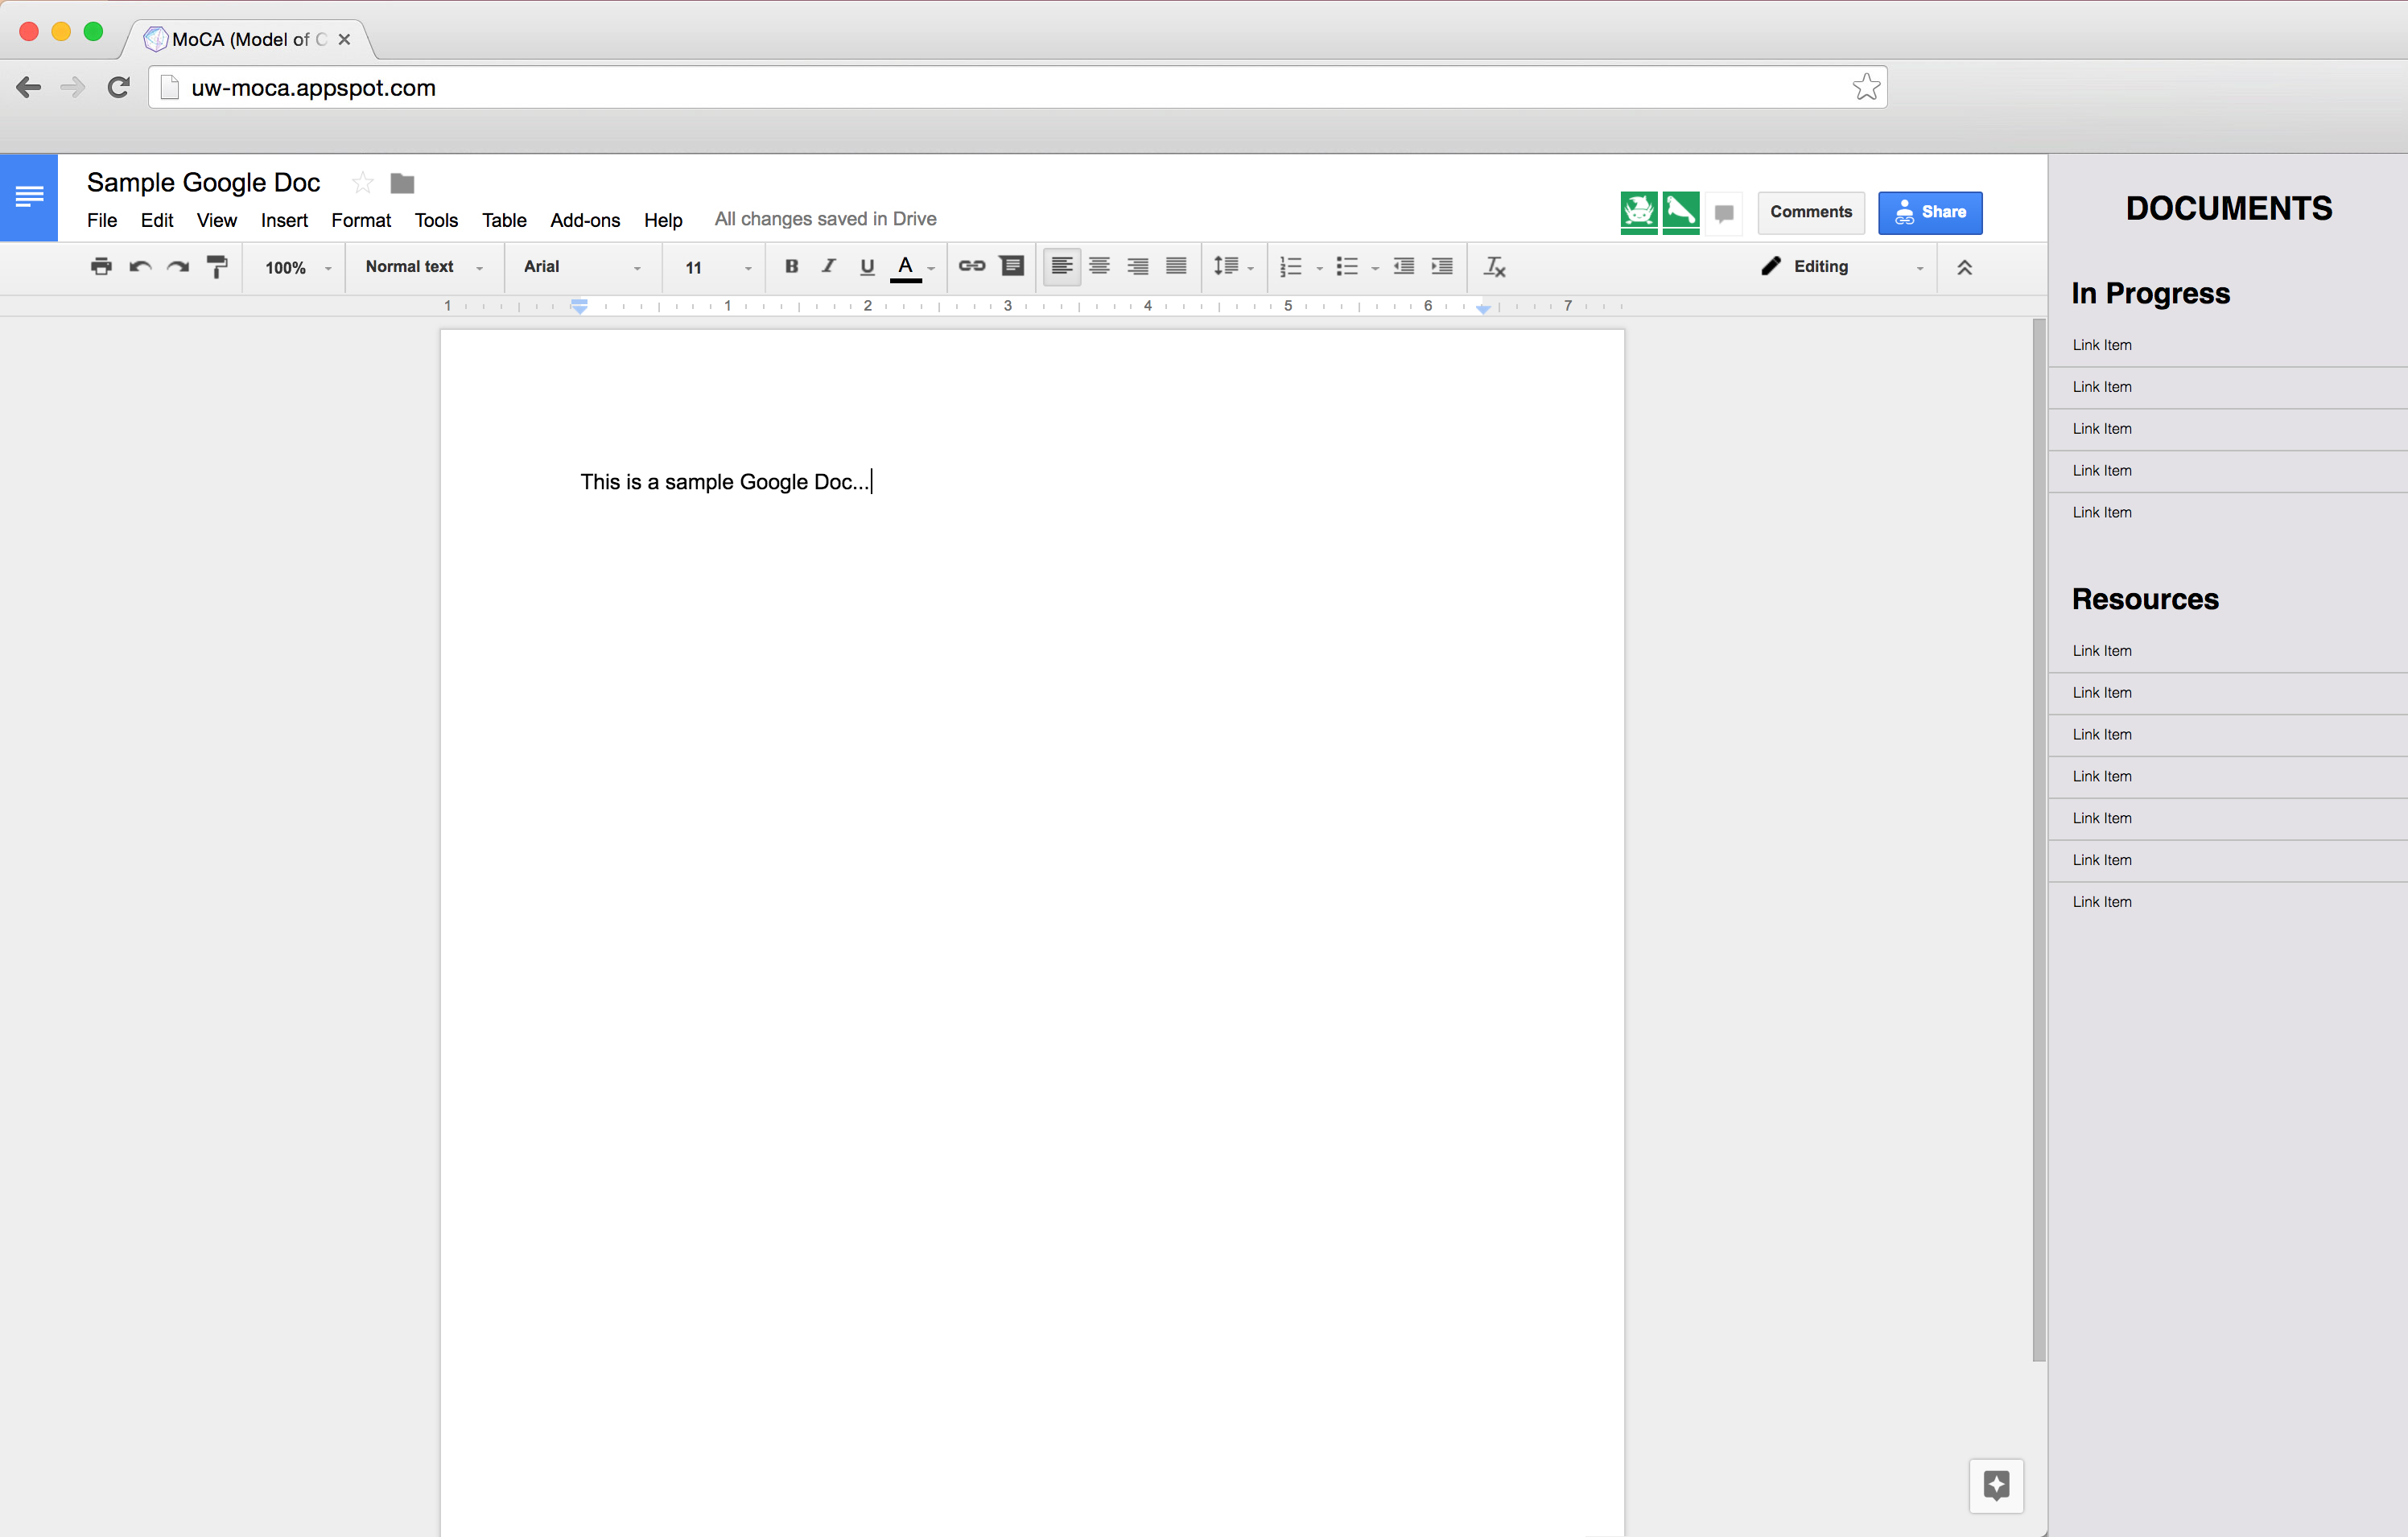
1. Document loads in the body. This example is loading a Google Doc that can be editable by the team.
2. Documents Menu has a list of working documents and resources. Clicking on a link will load the document.
The goal for this project was to create a tool that would help us view and edit papers, use a PDF search feature and see a map representation of the research sites from the publications using Google’s geo-location. These features add value by helping our team members interface with MoCA research data through an easy to use application with a better visual representation.
Next, we plan to explore the world of informatics. We want to be able to compare the data we have collected from the CSCW papers together in some sort of visual graph similar to the MoCA logo. I am looking into incorporating Tableau Software into a new Compare Papers view.
Changing directions can sometimes feel uncomfortable, especially when it is abrupt and you loose some work in the process. Keeping a flexible relationship between you and the work is the secret. If you can reduce your personal attachments to the work, and stay focussed on the greater goals, it can turn what seems like a loss into a huge success. Practicing attachment reduction and positive focus will keep you coming at the project in a clearer headspace.
During the development phase of this project, we ended up scrapping our base code in order to migrate to using Google App Engine. I lost two weeks of work and was now behind on the planned schedule, but it allowed us to use a better email system and create a better foundation for the application in terms of longevity and scaleability. A silver lining turned into a win!